R Statistics Tutorial: Using R programming for Data Analysis
Getting Started with using R programming language
R is a language and environment for statistical computing and graphics. It includes:
- An effective data handling and storage facility,
- A suite of operators for calculations on arrays, in particular matrices
- A large, coherent, integrated collection of intermediate tools for data analysis,
- Graphical facilities for data analysis and display either on¬ screen or on hardcopy, and
- A well developed, simple and effective programming language, which includes conditionals, loops, and user, defined recursive functions and input and output facilities.
This tutorial provides illustrated explanation of basic commands on R programming.
Basics of R software
{`
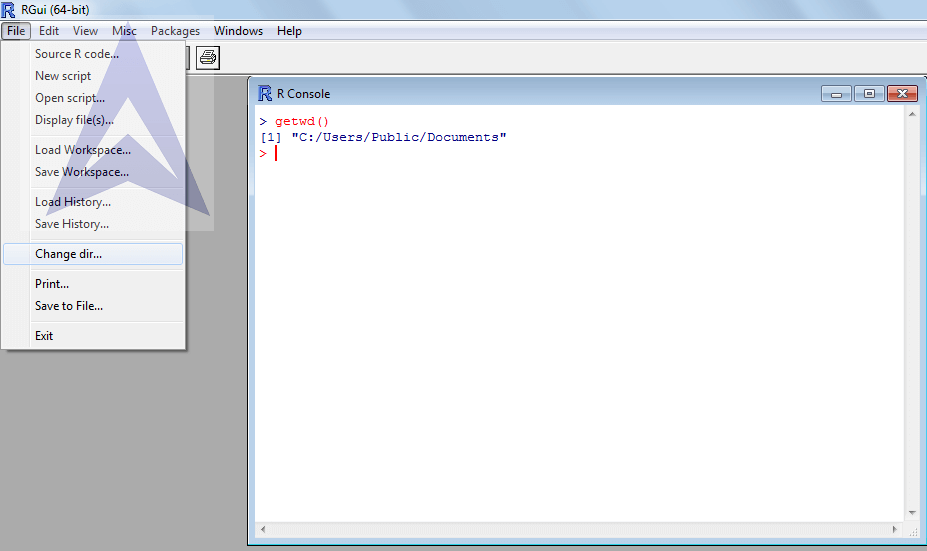
  Check the saved directory from where the work or data will be loaded using >getwd()
  This is essential especially when one does not know the working directory being used by R software.
  `}
{`
  To change the working directory,
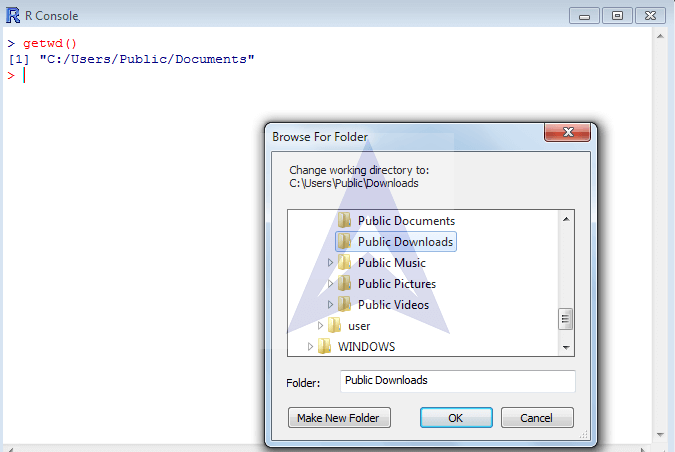
  File -> change directory and choose the directory.
  `}
{`
  > getwd()
  [1] "C:/Users/Public/Documents"
  > getwd()
  [1] "C:/Users/Public/Downloads"
  >
  `}
Working directory is changed.
Using R as a simple calculator.
{`Write any numbers and arithmetic operation to find the result.
  Use the function
  >power ()
  `}
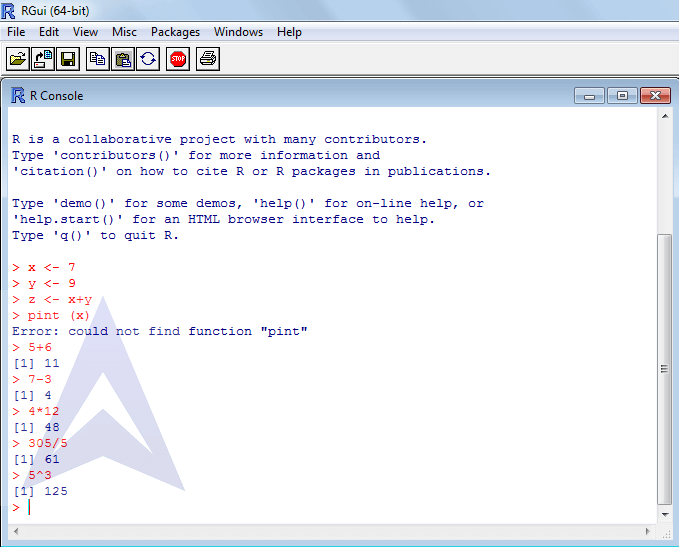
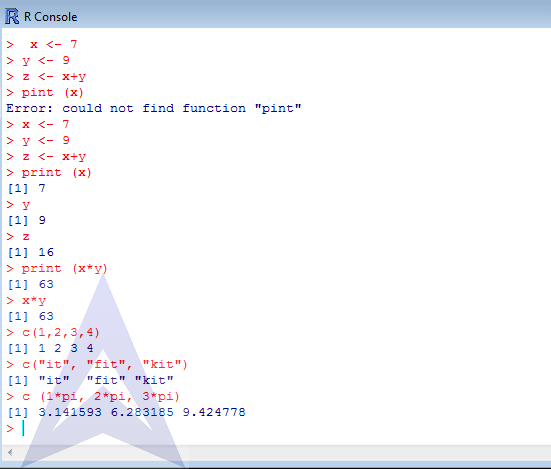
Assign values to operators using the assignment operator (<-). Assign sample values to a few variables.
Make a complex function by assigning the operation result of two variables in the third variable.
{`
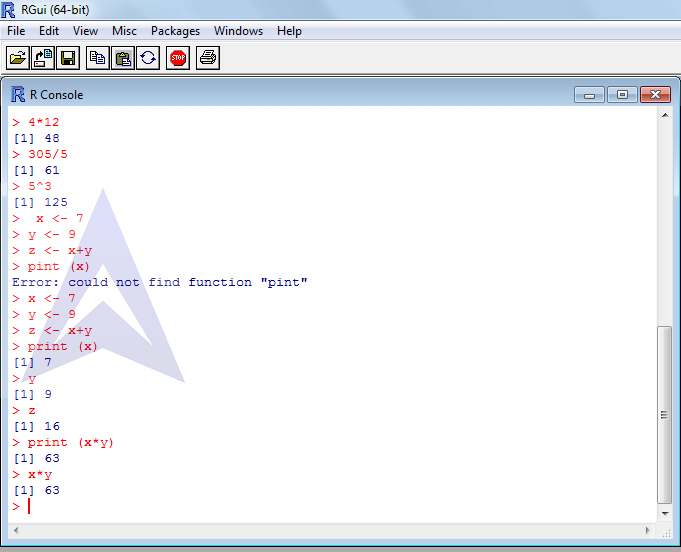
  To view the result type in R
  >print(x)
  and write the variable name in parenthesis.
  `}
Another method to see the result of an operation or command on R is to just type the variable name and press enter.
Also, the complex function can directly be printed without assigning another variable to it.
Naming a Variable in R
There are some pre-defined saved variables in R. in order to print them, simply enter the name of the variable.
{`
  > pi
  [1] 3.141593
  > sqrt (2)
  [1] 1.414214
  >
  `}
Reassigning value to a variable in R
To reassign value to a variable, simply redefine the variable and the old value gets replaced by the new value assigned.
{`
  > y <- 57
  > print (y)
  [1] 57
  > y <- 3005
  >
  > print (y)
  [1] 3005
  >
  `}
To list the variables in the current workspace
{`
  >ls()
  To get a list of the variable name along with its type, use the command
  < ls.str()
  `}
{`
  > x <- 90
  > y <- 65
  > z <- 09
  > a <- 90 "hello"
  > 1s()
  [1] "a" "x" "y" "z"
  > 1s.str()
  a : chr "hello"
  x : num 90
  y : num 65
  z : num 9
  >
  `}
Remove a variable by typing
{`>rm(x)`}
Remove unnecessary variables: After removing a variable, if you try to print it, it would prompt an error as the variable no longer exists.
{`
  > rm(x)
  > print (x)
  Error in print(x) : object 'x' not found
  > rm (z)
  >
  `}
To remove the whole list of variables in the workspace
{`
  >rm(list=ls())
  `}
This deletes all variables at once.
{`
  > rm(list=1s())
  >1s()
  character(0)
  >
  `}
In order to create a vector in R program, use the command
{`>c(1,2,3,4)`}
To assign a vector to a variable, use the same procedure as followed while assigning a value to a variable.
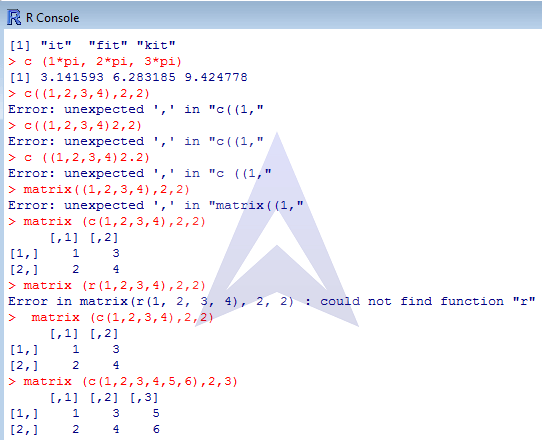
To create a matrix in R software, use the function:
{`>matrix (c(1,2,3,4),number of rows, number of columns)`}
Learn R programming for Exploratory Data Analysis
Basic Statistical Analysis using R
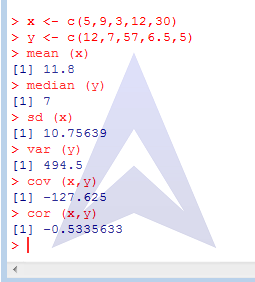
First define x and y vector with 5 observations each. Then use the following commands for the statistical computations:
| For finding Mean using R | > mean (x) |
| For finding Median using R | >> median (y) |
| For finding Standard deviation using R | > sd (x) |
| For finding Variance using R | > var (y) |
| For finding Covariance using R | > cov (x,y) |
| For finding Correlation using R | > cor (x,y) |
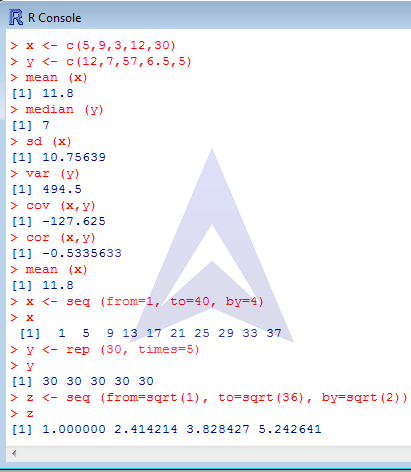
To assign a sequence to a variable use the command in R programming
{`>seq(from=1, to=40, by=4)`}
This will create a sequence starting from1 and having the fourth number as the next observation. The series thus ends at 37 (due to the by condition even though the last number was 40)
To assign a repeating sequence to a variable use the command:
{`>rep(30 , times = 5)`}
Here the function takes two arguments i.e. the number to be repeated (here, 30) and the number of times it is to be repeated (here, 5 times).
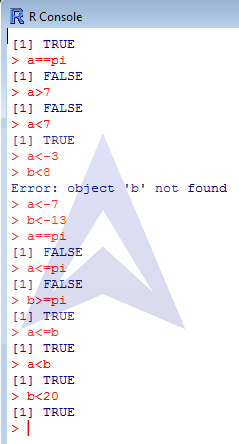
To compare 2 vectors using R:
To close the workspace, use the command
{`>q ()`}


