Signal processing assignment 2
Understanding the Fourier Transform:
PART I:
Question 1:
Using MATLAB calculate and display the Fourier Transform of DTMF Dial Tones:
Part (a):
As given in the notes for Fourier series the equation can be rewritten as:
X(t) = a0 + ak*cos(k*Omega0*t) + bk*sin(k*Omega0*t) + ak+1*cos(k*Omega0*t) + bk+1*sin(k*Omega0*t)…. So this can be put into a loop depending on the number of samples.
Let k = 1:N terms and a0 = 1/T*(sum(x)*dt)
Let Cos part = a(k+1)*cos(k*Omega0*t) and the Sin part=b(k+1)*Sin(k*Omega0*t)
Putting these into loop and add the Cos and Sin parts depending on number of samples.
This then gives: X(t) = a0 +Cos part + Sin part.
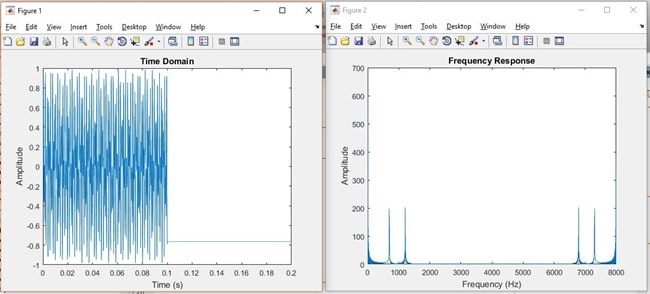
Instead of doing this over and over again Matlab has Fourier series function ‘fft’ and this was used to plot the magnitude and the frequency plots as below.
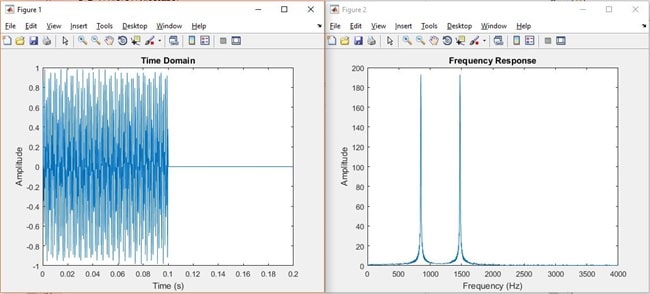
Note on the plot for Dial tone 1 both the peaks are clear to be see with the duplicate at the end.
The x axis scale has be halved on the Dial tone 9 to give better clarity of the centre frequencies which correspond to the 852Hz and 1477Hz as described in the DTMF standard.
Code used: (similar to the text and examples)
clear all
close all
%-------
% audio files as required
%----------
%FileName = 'dial0.wav';
%FileName = 'dial1.wav';
%FileName = 'dial2.wav';
%FileName = 'dial3.wav';
%FileName = 'dial4.wav';
%FileName = 'dial5.wav';
%FileName = 'dial6.wav';
%FileName = 'dial7.wav';
%FileName = 'dial8.wav';
FileName = 'dial9.wav';
%-------------
[y Fs] = audioread(FileName);
info = audioinfo(FileName);
nbits = info.BitsPerSample;
fprintf(1, 'Full info: \n');
disp(info);
% total number of sound samples
Nosamps = length(y);
%Time data for plot
t = (1/Fs)*(1:Nosamps)
%Fourier Transform using Fast Fourier Function
%Magnitude
y_fft = abs(fft(y));
y_fft = y_fft(1:Nosamps);
f = Fs*(0:Nosamps-1)/Nosamps; %Prepare freq data for plot
%--------
%Plot Sound File in Time Domain
figure
plot(t, y)
xlabel('Time (s)')
ylabel('Amplitude')
title('Time Domain')
%Plot Sound File in Frequency Domain
figure
plot(f, y_fft)
xlim([0 8000])
xlabel('Frequency (Hz)')
ylabel('Amplitude')
title ('Frequency Response')
Time and Frequency Domain plots.

Time and Frequency Plots for Dial Tone of 1.

Time and Frequency Plots for Dial Tone of 9. (Note: the Frequency (x) scale amended for clarity)
Q1. Part (b):
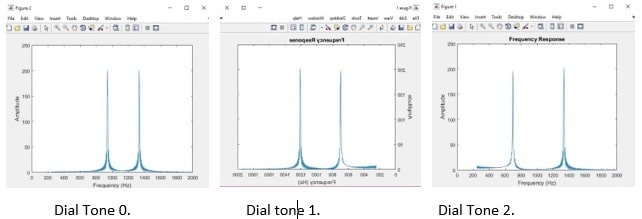
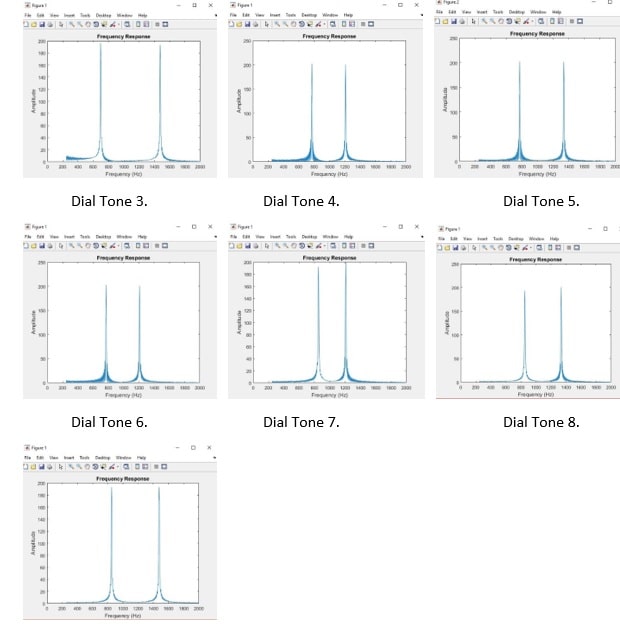
Find the frequency of the components and plot.
To find the frequencies of the FFT was to plot them and find where the maximums (peaks) occurred and convert this sample period to a time or frequency. To find the maximum values easier a threshold value was chosen by observation of the waveforms. This was to illuminate bad signals or noisy signals to give the correct value.
To make this simpler the find peak function was chosen to do the exact same function as the Max value function so all peaks were found and not just the first one.
The results as compared to the DTMF standard frequencies was very close as per the table below:
|
Dial Tone |
First Peak Frequency Hz |
DTMF Frequency Hz |
First Peak Frequency Hz |
DTMF Frequency Hz |
Error |
|
0 |
940 |
941 |
1335 |
1336 |
0.1 % / 0.1% |
|
1 |
695 |
697 |
1195 |
1209 |
0.3%/ 1.2% |
|
2 |
695 |
697 |
1320 |
1336 |
0.3% / 1.2% |
|
3 |
695 |
697 |
1475 |
1477 |
0.3% / 0.1% |
|
4 |
770 |
770 |
1210 |
1209 |
0% /0.1 % |
|
5 |
770 |
770 |
1335 |
1336 |
0% / 0.1% |
|
6 |
770 |
770 |
1475 |
1477 |
0% / 0.1% |
|
7 |
850 |
852 |
1210 |
1209 |
0.2% / 0.1% |
|
8 |
850 |
852 |
1320 |
1336 |
0.2% /1.2% |
|
9 |
850 |
852 |
1475 |
1447 |
0.2% / 1.9% |
Waveform Plots of the Peaks:


Code Used:
clear all
close all
%---------
% audio files as required
%---------
%FileName = 'dial0.wav';
%FileName = 'dial1.wav';
%FileName = 'dial2.wav';
%FileName = 'dial3.wav';
%FileName = 'dial4.wav';
%FileName = 'dial5.wav';
FileName = 'dial6.wav';
%FileName = 'dial7.wav';
%FileName = 'dial8.wav';
%FileName = 'dial9.wav';
%----------
[y Fs] = audioread(FileName);
info = audioinfo(FileName);
nbits = info.BitsPerSample;
fprintf(1, 'Full info: \n');
disp(info);
% total number of sound samples
Nosamps = length(y);
%Time data for plot
t = (1/Fs)*(1:Nosamps)
%Fourier Transform using Fast Fourier Function
%Magnitude
y_fft = abs(fft(y));
y_fft = y_fft(50:Nosamps/2);
%Blanking at start as Noisey data for plotting
f = Fs*(49:Nosamps/2-1)/Nosamps;
% locating peaks with a threshold setting
[pks,locs] = findpeaks(y_fft,'Threshold',30)
P1 = f(locs(1))
P2 = f(locs(2))
%------------
%Plot Sound File in Frequency Domain
figure
plot(f, y_fft)
xlim([0 2000])
xlabel('Frequency (Hz)')
ylabel('Amplitude')
title ('Frequency Response')
Question 2:
Q2. Part A:
Determine the sequence of tone dialled
To determine the key sequence of a sequence dialled it required the sampling if the tones in a sequential order and then moving on to the next tone once the first is recognised. There are many different way to achieve this but a comparison method was chosen for this example.
As each key tone is actually the combination of two prescribed frequencies by the DTMF standard it is possible to search these given tones by finding the individual frequency peaks and then adding the two main frequencies together to compare the sum against the know values for each of the key tone. For example the frequencies for the key No.3 is 697Hz and 1477Hz so when combined the sum of the frequency will equal 2174Hz. Once this is compared 2174Hz = 3. Then put a number 3 into the final memory register. Then go onto the next tone and then the next and so on until there are no more.
This comparison method can be done with a single comparison function and then looped back and used again for the next tone.
As not all signals will be perfect some simple filtering can be done to help improve the accuracy of the key recognition. The first is the narrow frequency window used by the DTMF system as the lowest number tone is 697Hz and the highest number tone is 1477Hz giving a total width of just 780Hz. These tones are also at the very low end of the voice spectrum so they do not interfere with most speech but can still be easily picked up by standard telephone systems.
Having a small frequency window allows for a simple bandpass filter to be used in the real world eliminating most of the static noisy that is often heard. This static is normally of a much higher frequency and one removed makes the key tone much clearer. Another thing is to allow for some tolerance in the summed frequencies for system errors in converting the tones back to the fundamental frequencies.
As mentioned earlier there many other way to do this but basically the fundamentals will be the same.
Code Used:
Q2. Part B:
Question 3:
This is the estimation of the noise that can be tolerated as determined in the previous question.
Code used:


