Big Data Sample Assignment
Part 1
The dataset contains the data of real Titanic passengers. There are 1310 values of passengers. The attributes include the values of The age, The passenger class, The sex of passengers, The amount of money they paid.
To analyze the data we need to follow the following steps:
1. Importing File
data=read.csv('titanic.csv')
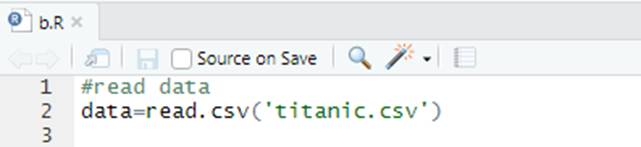
Fig.1 Importing File
2. deleting rows with missing data
data=data[complete.cases(data), ]
library('deplyr')
str(data)
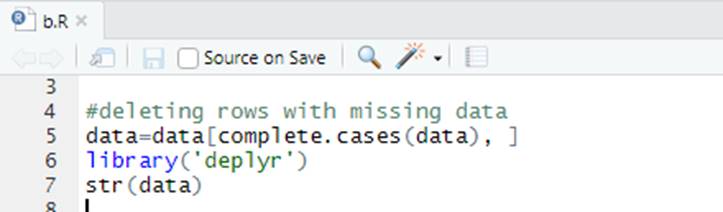
Fig.2 deleting rows with missing data
3. Data summarization
age=data$Age
spouse=data$No.of.Siblings.or.Spouses.on.Board
parents=data$No.of.Parents.or.Children.on.Board
fare=data$Passenger.Fare
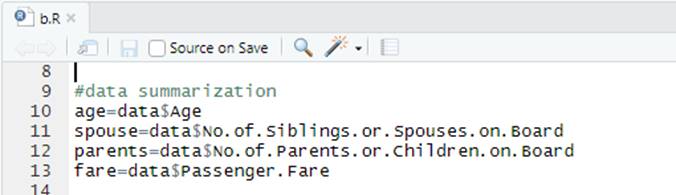
Fig. 3 Data summarization
4. Calculating central tendency and mean
meanage=mean(age)
meanspouseorsibling=mean(spouse)
meanparentsorchild=mean(parents)
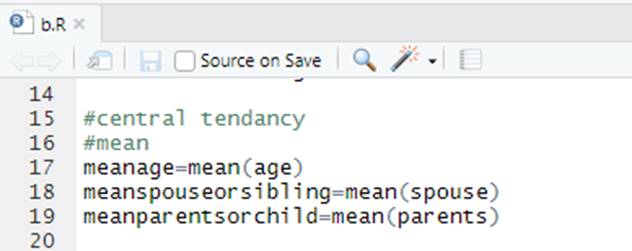
Fig. 4. Calculating central tendency and mean
5. Calculating median
mdage=median(age)
mdspouseorsibling=median(spouse)
mdparentsorchild=median(parents)
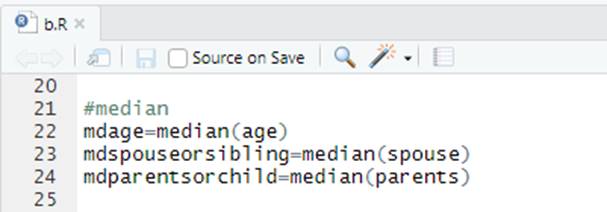
Fig. 5 Calculating median
6. Calculating Mode
modeage=getmode(age)
modespousesib=getmode(spouse)
modeparchild=getmode(parents)
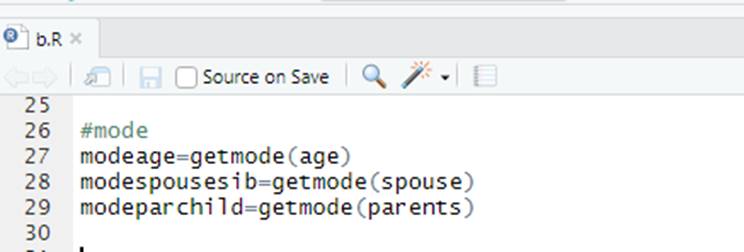
Fig. 6. Calculating mode
7. Methods of variation and standard deviation
sdage=sd(age)
sdspousesib=sd(spouse)
sdparchild=sd(parents)
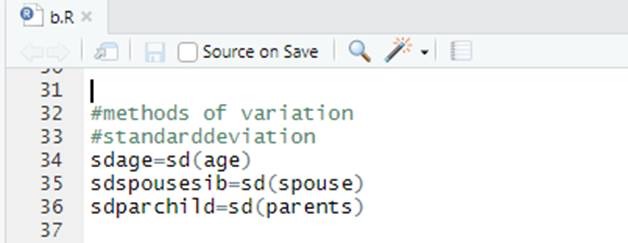
Fig. 7 Methods of variations and standard deviation
8. Calculating the variance
varage=var(age)
varspousesib=var(spouse)
varparchild=var(parents)
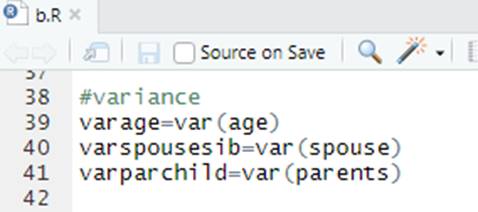
Fig. 8 Calculating the variance
9. Forming IQR
qrage=quantile(age)
qrspousesib=quantile(spouse)
qrparchild=quantile(parents)
print(qrage)
hist(age)
hist(spouse)
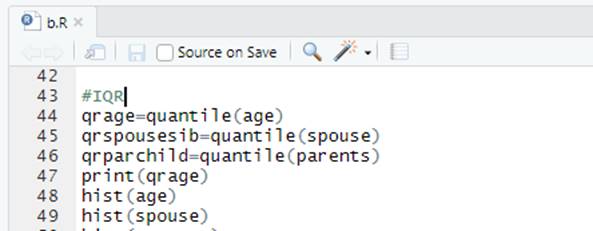
Fig. 9.1 Forming IQR(1)
hist(parents)
barplot(table(data$Survived))
data$Sex=factor(data$Sex,levels = c("Male","Female"),labels = c(0,1))
data$Survived=factor(data$Survived,levels = c("Yes","No"),labels = c(0,1))
data$Passenger.className=factor(data$Passenger.Class,levels = c("First","Second","Third"),labels = c(1,2,3))
data=data[-3]
data=data[-7]
data=data[-8]
data=data[-8]
data=data[-8]
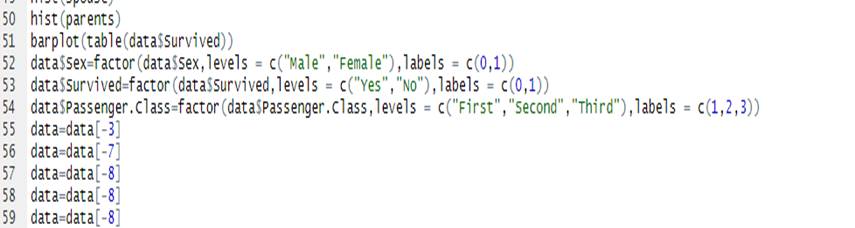
Fig. 9.2 Forming IQR(2)
i <- c(2,3) # Specify columns you want to change
data[, i] <- apply(data[ , i], 2, # Specify own function within apply
function(x) as.numeric(as.character(x)))
library(caTools)
set.seed(123)
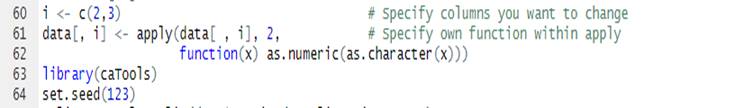
Fig. 9.3 Forming IQR(3)
split = sample.split(data$Survived, SplitRatio = 0.75)
training_set = subset(data, split == TRUE)
test_set = subset(data, split == FALSE)
training_set[-1] = scale(training_set[-1])
test_set[-1] = scale(test_set[-1])
classifier = rpart(formula= Survived~ .,data = training_set)
y_pred = predict(classifier, newdata = test_set[-1],type = 'class')
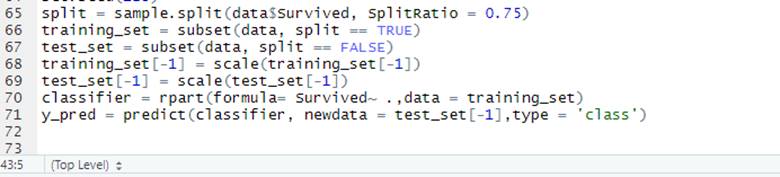
Fig. 9.4 Forming IQR(4)
10. Making the Confusion Matrix
cm = table(test_set[, 1], y_pred)
rpart.plot(classifier, box.palette="RdBu", shadow.col="gray", nn=TRUE)
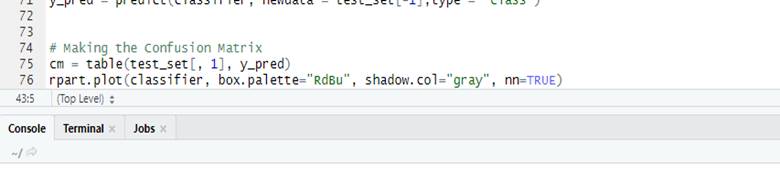
Fig. 10 Making the Confusion Matrix
Questions:
The questions are divided in a way that it discusses the type of data, that is it analysis the type of data and then the predictions are made using Decision-tree algorithm.
1. What is the average age of people on titanic?

The histogram is called to be plotted for the age. We will obtain the graph as follows:
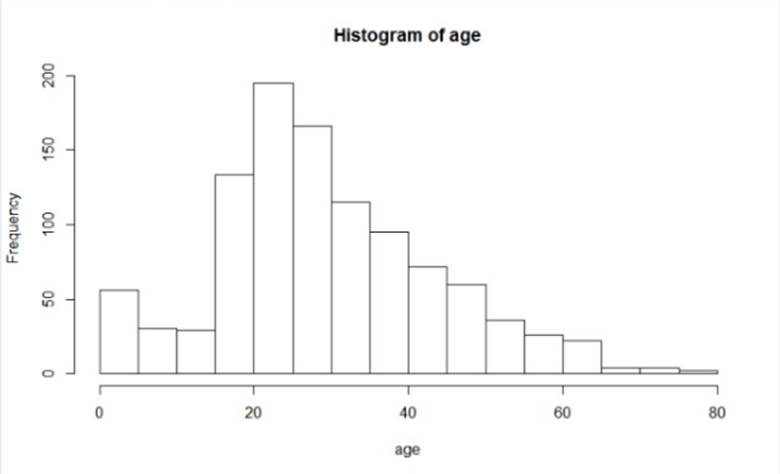
Fig. 11 `Histogram of age.
The result shows the Age of various individuals and frequency of their occurrences. We see that the number of people of age around 20 to 23 were highest on the titanic. The people of the age group 23 to 25 are the second majority population on the titanic. The people of age around 18-30 are the third majority. The people above the age of 65 are among the minorities. Maximum people lie between the age group of 18 to 40 this shows that the people on the cruise were mostly young. Other than that the people who between 40 to 60 are also in good number. The children of age 0 to 5 are more than the ones between 6 to 17.
2. What are the number of Parents/number of adults in each family?
The histogram is called to be plotted for the Parents in a family onboard. We will obtain the graph as follows:
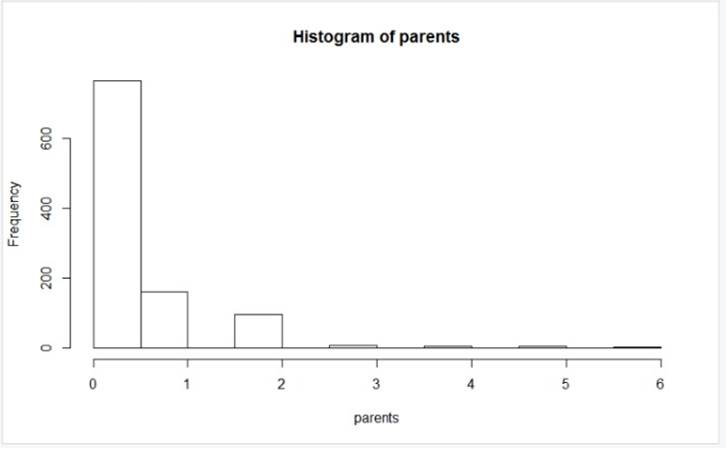
Fig. 12 Histogram of parents
The result shows the number of parents in every family. We see that the number of parents in a family is mostly zero. This shows that most of the families had zero children. There are more than 600 such families. There are few families with single parent as in only father or only mother. There are around 200 such families on the cruise. There are very few family with Two parents. Two parents denotes two generation of people are present in those families. But they are less than 100. The families with more than three and more than three parents are less even than 100.
3. What are number of peoples who survived?
The barplot is plotted using the following command.
The bar plot is plotted is as follows:
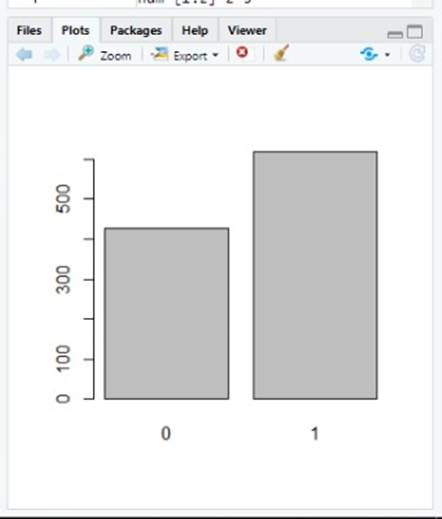
Fig. 13. Bar plot of people who survived
The graph above shows that the number of people survived and number of people died. The “0” represents “NO” or not survived that is died. The “1” denotes “yes” which means the individual survived. Out of total around 1300 individuals around 400 survived and 900 died. The percentage of survival is around 30 percent. Other 70 percent people died.
4. What is the number of passengers in each class?
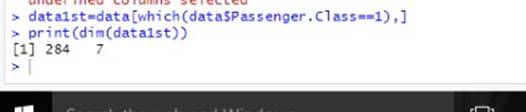
The histogram of various class of passengers are as follows:
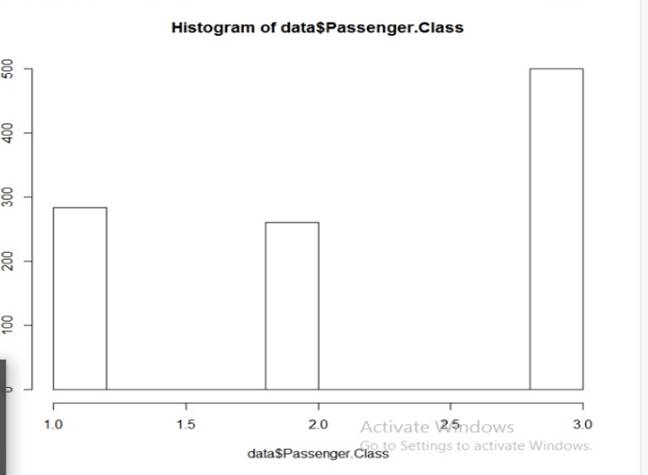
Fig. 14. Histogram of passenger’s class
The histogram displays passengers in various classes. The passengers in the third class are the most. There are around 700 passengers of first class which contribute about 50 percentage of the total passengers. Around 300 passengers were in first class and 300 passengers in second class. They are almost equal and contribute 25% each. This shows that the Titanic had equal number of rich and middle class people on board.
5. What is the age band of people survived age band of people died?
Following code gets you the band of age of people who died:

The graph shows that the age of people who died had its upper quartile as 40 and its lower quartile is given as 20. The median is obtained as around 28. The upper whisker reaches up to 62 and lower whisker reaches to as low as 1.
The graph shows that the age of the people who survived have upper quartile equal to around 42 and lower quartile close to 22. The average is obtained as 30. The upper whisker reaches up to 65 and lower whisker goes to as low as 1.
The following graph shows the box plot of age of people who survived.
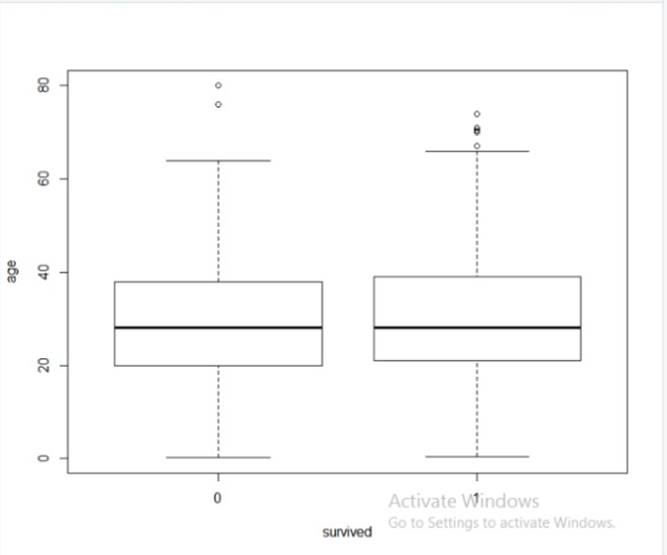
Fig. 15 Box plot graph for survived
Model building
Cleaning data
To analyze the data of the “titanic.csv” dataset we will have to firstly clean the data. The cleaning of data will start by separating the comma separated values to a column wise elements. The entries once fit in one column can be easily operated and analyzed. The values which are “Yes” or “No” are converted to “1” and “0” or in other words we convert values to Boolean values in order to do easy operations.
The values which are empty or “NULL” are replaced with the value of the median of the values present in the same column. In order to find the number of occurrences of any entity such as number of survivors we find number of “Yes” in survived column. This way frequency of every entity is obtained which can now be easily plotted.
The frequency of each entity is used to plot the graphs in order to display of each entity in the form of Histogram. The histograms of various entities have been displayed in the previous pages. We also obtain a box plot graph. Now, in order to make predictions, we will make a decision tree.
Decision tree approach
Decision tree is one of the most popular prediction and classification tool. A Decision tree is a flowchart like tree structure, where each inward hub means a test on a characteristic, each branch speaks to a result of the test, and each leaf hub (terminal hub) holds a class label.
A tree can be "educated" by parting the source set into subsets dependent on a characteristic worth test. This procedure is rehashed on each determined subset in a recursive way called recursive apportioning. The recursion is finished when the subset at a hub all has a similar estimation of the objective variable, or while parting never again increases the value of the expectations.
The development of choice tree classifier doesn't require any area information or parameter setting, and in this manner is proper for exploratory information disclosure. Choice trees can deal with high dimensional information. All in all choice tree classifier has great precision. Choice tree enlistment is a common inductive way to deal with learn information on characterization.
Decision trees order occurrences by arranging them down the tree from the root to some leaf hub, which gives the characterization of the case. An occurrence is grouped by beginning at the root hub of the tree, testing the property determined by this node, then descending the tree limb comparing to the estimation of the trait as appeared in the above figure. This process is then rehashed for the subtree established at the new hub.
Training and final resulting tree
The dataset once cleaned is fit in to the system in order to train it. The system once trained can predict the future data. The following graph shows the decision tree obtained on training the program.
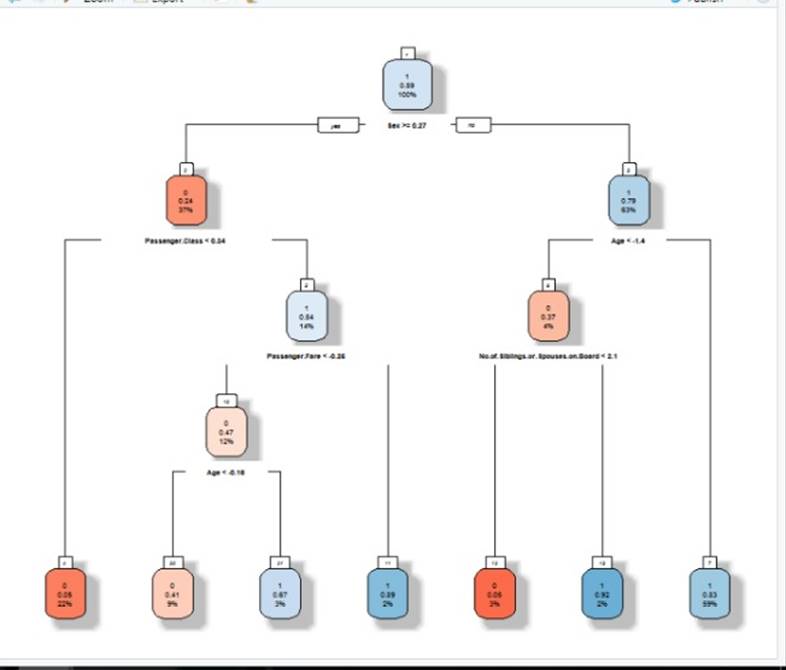
Fig. 16 Decision-tree for the case.
The decision tree divides into various prospects starting from SEX, then passanger’s class, the Age. In this way the passengers are classified in to various such classifications. The percentage written below each terms indicate the number of such individuals.
Part 2: Identify the design techniques used to mitigate the vulnerabilities in data privacy and security in sharing.
Following are some of the major challenges of Big data:
1. Manage the growth in data:
The data is growing continuously. Every company has to manage petabytes of data. It is estimated that every year the amount of data is doubled. This data include all kinds of information may it be a document, image, text, e-mails etc. It is difficult to manage this large amount of the data.
There are lots of different technologies present in the market which is used to physically store the data but it requires lot of physical space. The lot of energy is spent in storing this data and to manage them. The companies are working on lots of compression software to reduce this data.
The companies have also developed deduplication software. These software can really bring some important changes and can save millions of dollars’ worth of storage and computational power.
2. Unstructured data: The data is unstructured and of various kinds. It becomes difficult for the company to manage this data. Also unstructured data is difficult to analyze while generating insights.
3. Generating insights when the need arises or regularly:
The main objective of storing such enormous data is to get important business insights. It is important that the data is stored in a way that it is easily accessible. The common goals a business wants to achieve with this data are as follows:
· Diminishing costs through operational cost efficiencies
· Building up an information driven culture
· Making new roads for development and interruption
· Quickening the speed with which new abilities and administrations are conveyed
· Propelling new item and administration contributions
4. Hiring the individuals to handle big data:
In order to manage, update, develop and run various applications of big data, it becomes important that the company hires the right individual. The demand for this job is high but the individuals capable of handling such operations are less in the market. Due to this the salaries of such individuals has been keep on increasing. It has become difficult for the companies to afford these individuals and for the startups to do hire them.
In order to deal with this shortage of such people, the company has followed three major options:
1. Increased the budget of hiring and increased the time of screening of each individual. Companies have also introduced many ways in order to retain the hired individuals.
2. The companies have organized various training programs in order to train their existing employees. This way the company saves a lot of money which it had to spend in hiring a new individual.
3. Investing in technologies build on machine learning capabilities. The company is buying various analytics services to avoid spending money on hiring individuals.
5. Data integration:
The data of an organization comes from different sources. Some of the sources are social media streams, enterprise applications, email systems etc. It is challenging to combine all these data and create reports. There are various consultancy companies who offer various tools and ETL for data integration but the company is not satisfied with their performance.
Many companies are investing in the big data tool. According to a report of IDG, the companies investing in big data technology tools are around 89 percentage. In next 12 to 18 months these companies will be completely dependent on this tools. The data integration was the second major challenge because of which the company is looking for the tools.
6. Validating data:
Similar to integration, validation is one more challenge. Frequently associations are getting comparable bits of information from various frameworks, and the information in those various frameworks doesn't generally concur.
For instance, the web based business framework may show day by day deals at a specific level while the undertaking asset arranging (ERP) framework has a marginally unique number. Or then again an emergency clinic's electronic wellbeing record (EHR) framework may have one location for a patient, time an accomplice drug store has an alternate location on record.
Understanding information administration challenges is exceptionally mind boggling and is typically requires a mix of approach changes and innovation. Associations regularly set up a gathering of individuals to supervise information administration and compose a lot of strategies and methods.
They may likewise put resources into information the executives arrangements intended to disentangle information administration and help guarantee the exactness of huge information stores — and the bits of knowledge got from them.
7. Security of the big data:
The company has concerns for the storage of such big data. The big data sources are often targeted by the hackers. Hence the safety is their top priority.
Most of the companies believe that their data is safe, but around 40 percentage company still uses additional security tools. Most of the companies usually include access control measures, data segregation and data encryption.
8. Organizational resistance:
It can't the mechanical parts of enormous information that can be testing — individuals can be an issue as well. In the NewVantage Partners overview, 85.5 percent of those reviewed said that their organizations were focused on making an information driven culture, yet just 37.1 percent said they had been fruitful with those endeavors.
When gotten some information about the hindrances to that culture move, respondents highlighted three major deterrents inside their associations:
1. Deficient authoritative arrangement (4.6 percent)
2. Absence of center administration reception and comprehension (41.0 percent)
3. Business opposition or absence of comprehension (41.0 percent)
With the end goal for associations to profit by the open doors offered by huge information, they will need to do a few things another way. Furthermore, that kind of progress can be colossally hard for huge associations.
9. Real time operations are difficult:
Due to enormous and complex data, real time analysis and operations becomes difficult and closely impossible.
10. Various other Challenges: Other difficulties may happen while coordinating enormous information. A portion of the difficulties incorporate joining of information, ability accessibility, arrangement cost, the volume of information, the pace of change of information, veracity and legitimacy of information.
References
big-data-challenges . (n.d.). Retrieved from datamation: https://www.datamation.com/big-data/big-data-challenges.html
decision-tree . (n.d.). Retrieved from geeksforgeeks: https://www.geeksforgeeks.org/decision-tree/
four-common-big-data-challenges . (n.d.). Retrieved from dataversity: https://www.dataversity.net/four-common-big-data-challenges/
the-6-challenges-of-big-data-integration . (n.d.). Retrieved from flydata: https://www.flydata.com/the-6-challenges-of-big-data-integration/


