Assignment Help with Supply
Supply
Meaning of supply
Supply is the quantity of a good or service sold or willingness to sell for consumption by the producer for a price at a given point of time.
Market supply
Consider the supply schedule below:
| Price | Quantity supplied by | Market Supply | ||
| $ | A | B | C | A+B+C |
| 10 | 40 | 60 | 80 | 180 |
| 8 | 30 | 45 | 60 | 135 |
| 6 | 22 | 33 | 44 | 99 |
| 4 | 15 | 23 | 30 | 68 |
| 2 | 10 | 15 | 20 | 45 |
We can see in the above table, the supply schedule of three producers A, B and C for various price levels. As seen in the table above the supply of goods decreases as the price of the goods fall. Now consider that the market consists of only these three suppliers, so the market supply will be the sum of the goods supplied at various price levels all other things remaining same. The same is depicted using the charts below. The first three charts shows the individual supply curve of A, B and C as per the supply schedule above, while the chart below that depicts the market supply curve i.e. the aggregate supply of A, B and C


Law of supply
The law of supply sass that the quantity of a good offered or willing to offer by the producer/owners for sale increase with the increase in the market price of the good and falls if the market price decreases, all other things remaining unchanged An increase in price will increase the incentive to supply which means that supply curves will slope upwards from left to right. Supply curves can be curves or straight lines Consider the supply of labour as in the figure below:

The above supply curve shows the hours per week at job by the labour on the X axis and hourly wages on the Y axis. As we can see that as the hourly wages increases the hours spent on job also increases. Thus the supply curve is a left to right upward sloping curve
Determinants of supply
Quantity supplied of a good/ service is affected by various factors. Several key factors affecting supply are discussed as below:
- Price of the product: Since the producer always aims for maximising his returns/profit, so the quantity supplied changes with increase or decrease I the price of the good.
- Technological changes: Advanced technology can yield more quantity and at lesser costs. This may result in the producer to be willing to supply more quantity of the goods
- Resource supplies and production costs: Changes in production costs like wage costs, raw material cost and energy costs might impact the producers’ production and eventually the supply. An increase in such cost might result in lesser quantities produced and thus lesser quantities supplied and vice versa
- Tax or subsidy: Since the producer aims to minimise costs and expand profit, an increase in tax will increase the total cost, thereby decreasing the supply. Similarly a subsidy might incentivise the producer to supply more of that goods in order to maximise his profits. Tax and subsidy are two important tools used by central government to control supplies of certain goods. For example an increase in tax can be used to reduce the supply of cigarettes, while and increase in subsidy can be used to increase the supply of fertilizers
- Expectations of prices in future: An expectation that the prices of goods will fall in future might lead to lessen the production by the producer an dthereby decrease the supply and vice-versa.
- Price of other goods: A producer might have several options to produce. Since the money to invest is limited with the producer he would decide to produce the good which offers him the maximum profit. Thus if the producer is currently producing good A and the price of good B increases than he might switch to producing good B as this would result in better returns for him.
- Number of producers in the market: This is a very important factor or determinant of supply. If there are large number of producers or sellers in the market willing to sell goods than the supply of good will increase and vice versa.
Supply function
Supply function expresses the relationship between supply and the factors (the determinants of supply, as discussed above) affecting the producer/supplier to offer goods for sale.
For instance take the supply function as below
Qs = f( P, Prg, S )
where;
P = price;
Prg = price of related goods; and
S = number of producers.
The supply curve is the graphical representation of the supply function and it shows the quantity of a good that the seller is offering or willing to offer at various prices
Movement along and shifts in supply curve
Changes in the determinants of the supply cause movement along the supply curve or shifts in the supply curve.
We will discuss these two phenomenons in detail as below:
Movement along the supply curve
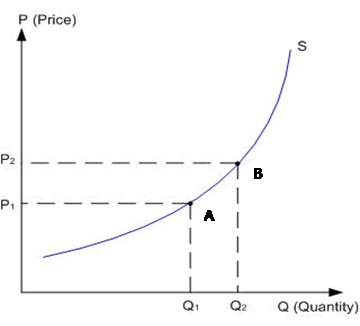
Movement along the supply curve happens due to change in the price of the good and resulting change in the quantity demanded at that price. For instance, an increase in the price of the good from P1 to P2 in the figure below results in an increase of quantity supplied of the good from Q1 to Q2. This movement from point A to point B on the supply curve S due to change in price of the good all other factors of supply remaining unchanged is called movement along the supply curve.
Shifts in the supply curve
Shift in the supply curve is also sometimes referred as a change in supply. This happens due to changes in factors of supply other than that of price of the good For example, if the price of a factor of a related good increases the supply curve shifts. Similarly changes in technology and government tools like tax and subsidy tends to shift supply curve.
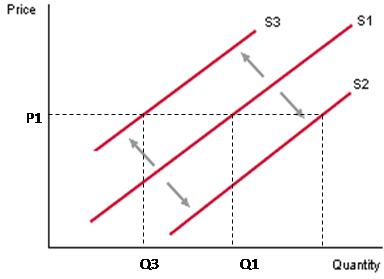
The supply curve can shift to the right or left as shown in the figure below. A shift towards the right i.e. from S1 to S2 curve denotes an increase in supply of the good at all levels of prices. Similarly a shift in the supply curve from S1 to S3 denotes a decrease in supply of the good at all levels of prices As seen in the figure above a rightward shift in the supply curve from S1 to S2 increases supply from Q1 to Q2 while the price of the good remains same at P1. Similarly a leftward shift from S1 to S3 decreases supply from Q1 to Q3 whilst the price remaining unchanged at P1 A shift in supply will occur if either of the following changes:
- the (opportunity) cost of resources needed to produce the good
- the technology available to produce the good.
Either factor could cause the supply curve to shift to the left (a decrease in supply) or to the right (an increase in supply).
Backward bending supply curve
Backward-bending supply curve is an example of supply curve where higher price of the good does not result to a higher quantity supplied Due to higher prices the producer/ suppliers of goods may choose to produce less due to the income effect of higher prices. For example farmers could choose to decrease man hours of work when prices rise. The backward bending supply curve is generally explained with wage rate on Y axis and the quantity of labour supplied on the X axis. As per the law of supply as the wage rate increases, the higher quantity of labour will be supplied. But after a certain point, the labourers might start to work less for increase in wage rate because the higher wage makes the workers wealthier and leaves them with more income even with less work. Thus they tend to choose between leisure and work. The reason for this can be explained with the help of income effect and substitution effect. As per the Substitution effect a higher wage makes work more desirable than leisure, thereby increasing supply. Thus the substitution effect is positive for supply Alternatively as per the income effect a higher wage results in higher income by working less hours, thereby decreasing the work hours. Thus the income effect is negative. When the negative income effect becomes higher than the positive substitution effect, the backward bending supply curve of labour gets formed. The concept of backward bending supply curve is depicted in the figure below

As the wage rate increases from w1 to w2, the quantity of labour increases from Q1 to Q2, but when the wage rate rises further to w3, the quantity of labour falls to Q3.
Microeconomics Assignment Help | Microeconomics Help | Supply | Supply Chain | Aggregate Supply | Supply Chain management | Supply Chain Solutions | Online Tutoring


